
We have just published some statistics for the most preferred categories of additional benefits chosen by employees during the first quarter of 2023. These corporate benefits serve as an effective incentive for attracting and retaining talent, while also demonstrating an employer’s care for the well-being of their talents.
Our study examines the significance that employees attach to different categories of benefits accessible through Re:benefit’s platform. Employees can choose from over 120 additional benefits offered by more than 40 companies.The first graph illustrates the distribution of the most popular benefits among employees:
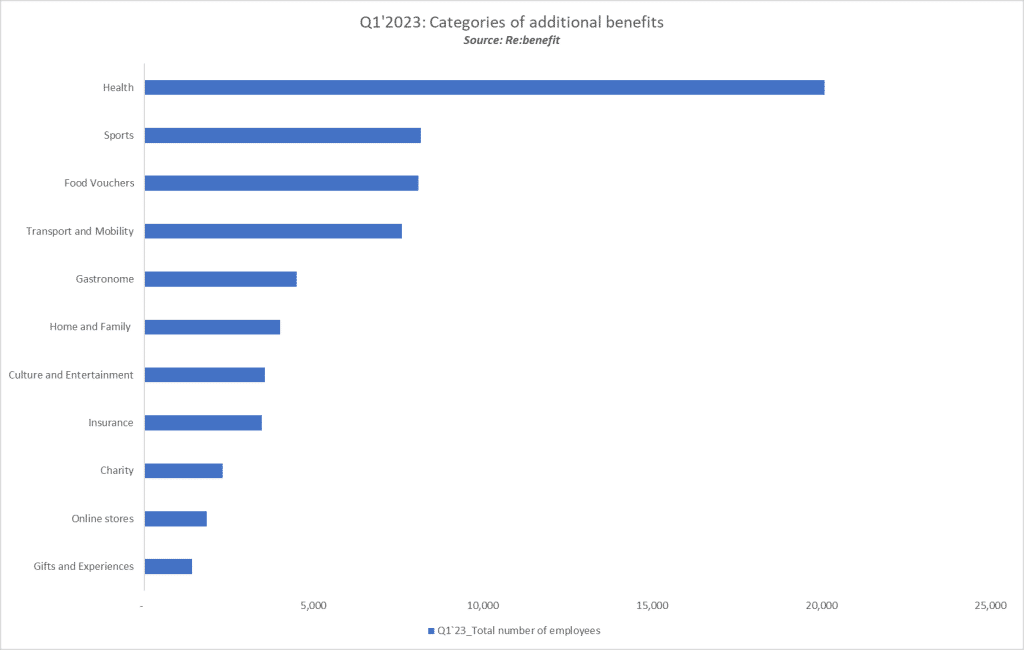
The most favorite among employees are benefits from the categories of “Health,” “Sports,” “Food Vouchers,” and “Transport,” which have been used by the highest number of people. Interestingly, preferences for the “Gifts and Experiences” category have significantly decreased compared to previous periods, ranking last on the list during the first quarter of 2023.Based on the criteria of budget allocation relative to the total number of employees, we identify the largest amount of invested funds in insurance, sports, and cultural benefits:

Here are the most popular benefits among employees in the different age groups:
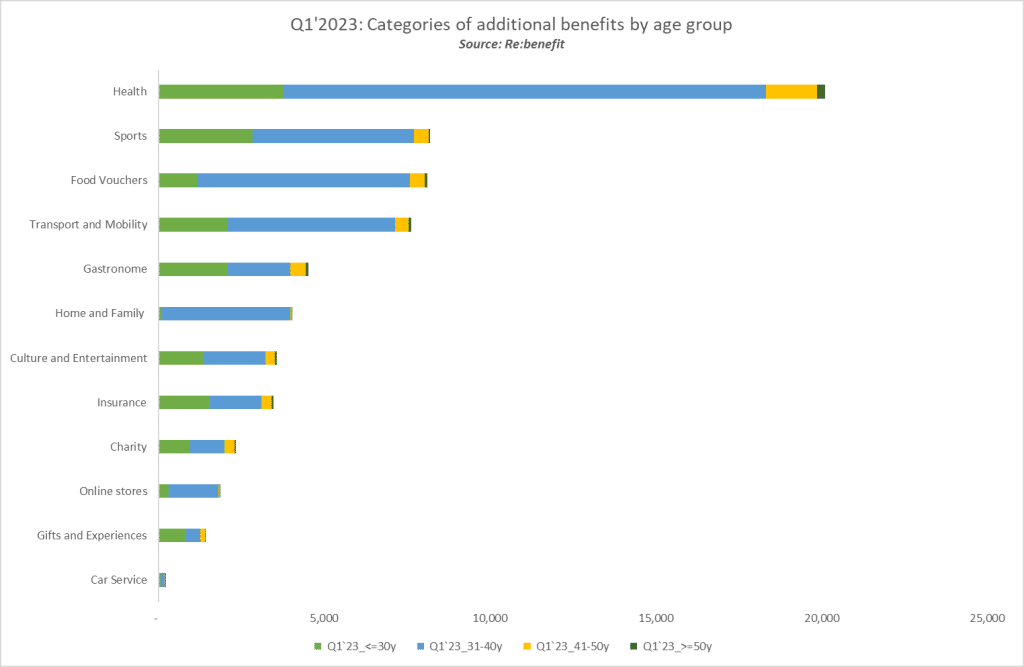
The categories of “Health,” “Sports,” “Food Vouchers,” and “Transport” are the most sought-after among employees, according to our survey. Sports activities receive the widest approval among employees aged 31 to 40. Food vouchers are the second preference for the 31 to 40 age group, but they also have a strong influence on the audience aged 41 to 50. Benefits from the “Transport” category, such as fuel vouchers, public transportation cards, and taxi vouchers, are more preferred by the youngest age group (under 30). However, they remain in the top 4 preferred benefits for other age groups as well. Family support is the fifth most chosen category among employees aged 31 to 40. In this category, employees have selected benefits such as childcare services, professional home cleaning, etc.
In the next graph, we observe the distribution of preferences for additional benefits by gender:
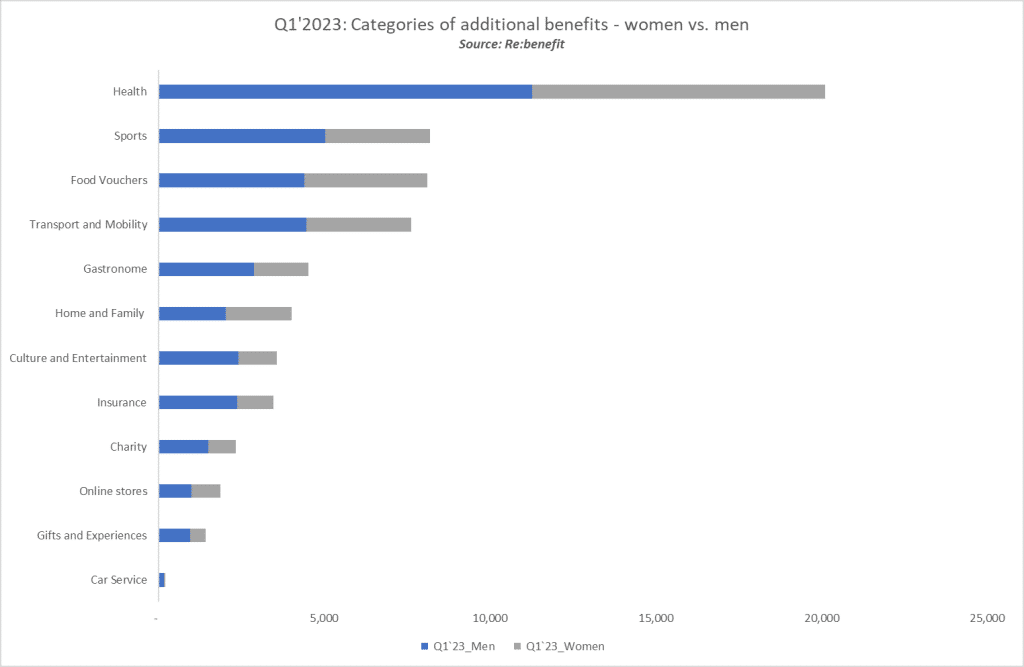
What benefits do men prefer?
In addition to health benefits, men prioritize sports-related benefits. The next most preferred ones are food vouchers and transport services, which have comparable values. Men’s preferences for the “Gastronomy” category exceed those of women. The same trend is observed for benefits associated with charity and donations.
What is the choice for corporate benefits among women?
Food vouchers receive the biggest approval, followed by similar preferences for the “Sports” and “Transport” categories. They show less interest compared to men when it comes to selecting insurance and cultural – entertainment benefits.In the fifth graph below, there is data for preferred benefits by gender and based on budget allocation:
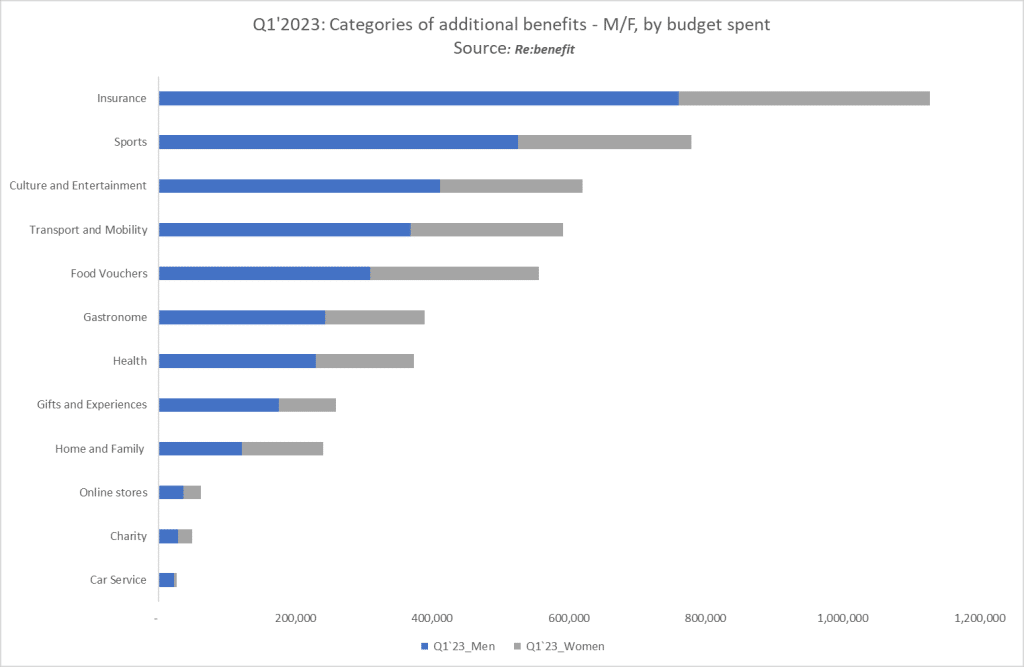
We observe that men allocate the largest budget for insurance, sports, cultural-entertainment, and transport benefits. The female audience has invested the most of their budget primarily in the “Insurance” category, as well as in “Sports,” “Food vouchers,” “Transport,” and “Culture and entertainment.”
In the last graph, the focus is on the distribution of budget allocation based on age group:
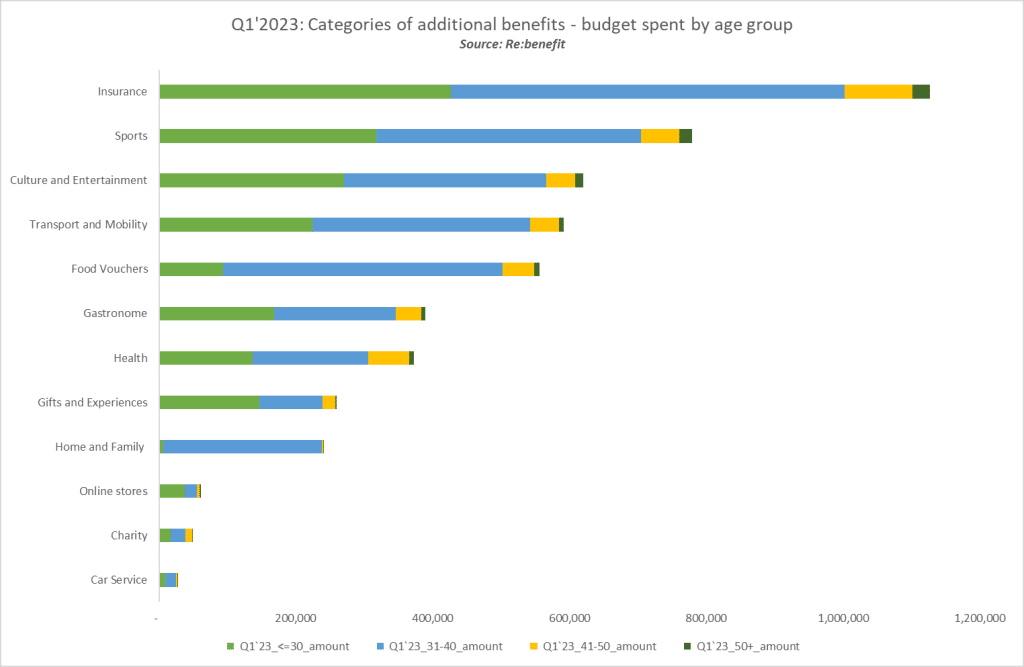
The trend here shows that the majority of the budget is allocated by employees for insurance services. The largest age group, employees between 31 and 40 years old, allocate their financial resources for additional benefits in the categories of “Sports,” “Food vouchers,” “Transport,” “Culture and entertainment,” and “Family support.” On the other hand, the youngest age group, under 30 years old, prefer sports, entertainment, and transport when planning their available budget for monthly benefits.
Source: Re:benefit